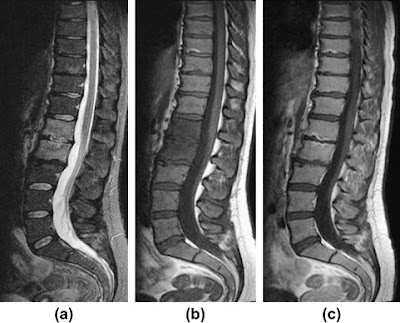
Type 1 changes are T1 hypointense and T2 hyperintense. Like most other areas in the body that exhibit this signal pattern, it is a reflection of increased fluid content in the endplate... signifying bone marrow edema and inflammation. Type 1 changes exist in a spectrum from Type 1 --> Type 2, indicating an evolution of the degenerative process. Type 2 can then become active again: Type 2 --> type 1. If caught at a transition point, the changes are a mixed type 1/2.
 |
| T1 sagittal image of the lumbar spine demonstrates a band of decreased signal at the superior L3 endplate and inferior L2 endplate... the decreased signal is an indication of edema. |
The diagnostic dilemma concerning Modic Type 1 changes is that an infectious process (i.e. a discitis) has a similar pattern in the vertebral bodies with inflammation and edema at both endplates adjacent to an infected disc. The deciding factor is the appearance of the disc itself. Discitis presents with increased T2 signal intensity, whereas a degenerated, dessicated disc presents with normal or hypointense signal on T2-weighted sequences. Also, in an infection, other signs are likely to be present, such as erosion of the endplates, a paravertebral soft tissue mass, and appropriate lab tests (CRP (100% sensitive) and ESR).
Current opinion also believes that Modic type 1 changes represent a more active form of degenerative change and increased inflammatory cytokines have been recovered from Type 1 vertebral bone. This Modic type is believed by some to be most closely related to lower back pain, but this remains controversial and studies have been limited by small sample sizes.
1. Rahme R, Moussa R. "The Modic Vertebral Endplate and Marrow Changes: Pathologic significance and Relation to Low Back Pain and Segmental Instability of the Lumbar Spine." AJNR 29 (May 2008) pp. 838-842.
2. Dunbar JAT, Sandoe AS, et al. "The MRI appearances of early vertebral osteomyelitis and discitis," Clinical Radiology, Volume 65, Issue 12, December 2010, Pages 974-981,

